Mastering Bode Plot: Unveiling Insights into System Dynamics
Navigating the intricate dynamics of complex systems requires powerful analytical tools, and among the most indispensable is the Bode plot. As a graphical representation of a system’s frequency response, the Bode plot unveils invaluable insights into its behavior across a spectrum of frequencies. From engineers crafting precise control systems to researchers unraveling the mysteries of electronic circuits, understanding and interpreting Bode plots is paramount. Join us on a journey through the intricacies of Bode plots, where we explore their applications, decipher their components, and unlock their potential for innovation and discovery.
What is a Bode Plot?
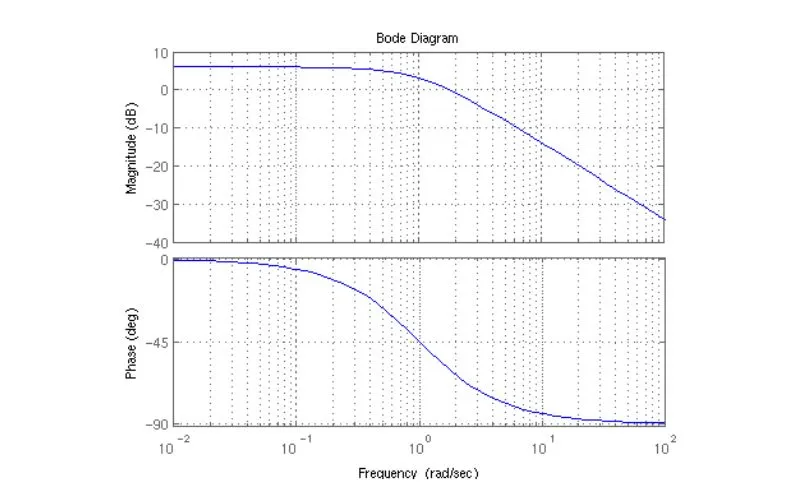
A Bode plot is a graphical representation of a system’s frequency response. It consists of two plots: one showing the magnitude response (in decibels) and the other showing the phase response (in degrees) of the system as a function of frequency. The frequency is typically plotted on a logarithmic scale, making it easier to analyze the system’s behavior across various frequencies.
Key Components of a Bode Plot
Understanding the components of a Bode plot is essential for interpreting its significance accurately:
- Magnitude Plot: The magnitude plot displays the system’s magnitude response in decibels (dB) versus frequency. It provides insight into how the system amplifies or attenuates input signals at different frequencies.
- Phase Plot: The phase plot shows the phase shift introduced by the system as a function of frequency. It indicates the time delay or advance of the output signal relative to the input signal.
- Corner Frequency: The corner frequency is the frequency at which the magnitude of the system’s response deviates significantly from its low-frequency behavior. It is often denoted as ωc, a crucial parameter in system analysis.
Interpreting Bode Plot
Interpreting Bode plots requires a solid understanding of their key components and how they reflect the behavior of dynamic systems. Engineers and researchers can gain valuable insights into the system’s characteristics under consideration by analyzing the magnitude and phase responses across a range of frequencies. Let’s delve into the various aspects of interpreting Bode plots.
Magnitude Plot Analysis
The magnitude plot of a Bode plot provides crucial information about how the system responds to different frequencies. By examining the magnitude response, engineers can determine the system’s gain at various frequencies and identify resonant peaks and bandwidth limitations.
- Gain Analysis
- Resonant Peaks Identification
- Bandwidth Assessment
Phase Plot Analysis
The phase plot complements the magnitude plot by showing how the phase of the system’s output signal changes with frequency. Phase analysis is essential for understanding the time delay or advance introduced by the system and assessing its stability and transient response characteristics.
- Phase Shift Assessment
- Stability Analysis
- Transient Response Evaluation
Gain and Phase Margins
Gain margin and phase margin are critical indicators of a system’s stability. Engineers analyze these margins to ensure the system remains stable under varying operating conditions. By determining the amount of gain or phase adjustment the system can tolerate before becoming unstable, engineers can optimize controller parameters and design robust feedback control systems.
- Stability Assessment
- Controller Optimization
- Stability Margin Calculation
Crossover Frequency
The crossover frequency is the frequency at which the magnitude and phase plots intersect. It provides insights into the system’s bandwidth and stability characteristics. Engineers use the crossover frequency to determine the frequency range over which the system operates effectively and to assess its stability margins.
- Bandwidth Estimation
- Stability Margin Assessment
- Frequency Range Identification
Applications of Bode Plot
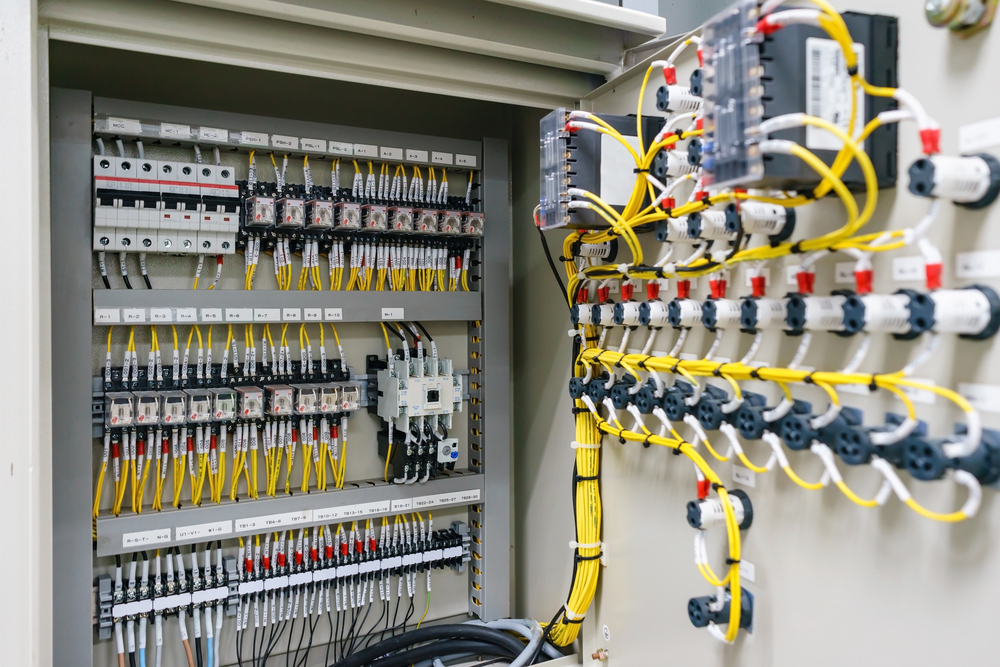
Bode plots find extensive applications across various domains because they provide valuable insights into systems’ frequency response. From control systems design to electronics and signal processing, Bode plots are indispensable for engineers and researchers.
Control Systems Design
Bode plots play a crucial role in the design and analysis of control systems. Engineers use Bode plots to assess the stability and performance of feedback control systems, ensuring that the system meets desired specifications such as stability margins, bandwidth, and transient response. Engineers can optimize controller parameters to achieve robust and stable control systems by analyzing the gain and phase margins.
- Stability Analysis
- Controller Design
- Stability Margins Optimization
Filter Design
Filters are essential for extracting relevant information and removing unwanted noise in signal processing applications, such as audio and image processing. Bode plots facilitate the design and optimization of filters by providing a clear visualization of the frequency response. Engineers can analyze the magnitude and phase characteristics to design filters with specific cutoff frequencies, passband ripple, and stopband attenuation, ensuring optimal performance in various applications.
- Low-Pass, High-Pass, Band-Pass Filter Design
- Frequency Response Analysis
- Passband Ripple and Stopband Attenuation Optimization
Electronics
Bode plots are widely used in electronics to analyze the frequency response of amplifiers, oscillators, and other electronic circuits. Engineers leverage Bode plots to evaluate electronic systems’ gain, bandwidth, and phase response, enabling them to design circuits with desired frequency characteristics. By understanding the frequency-dependent behavior of electronic components, engineers can optimize circuit performance and mitigate issues such as distortion and instability.
- Amplifier Frequency Response Analysis
- Oscillator Design and Analysis
- Stability Analysis in Electronic Circuits
FAQs
What is the significance of the corner frequency in a Bode plot?
The corner frequency marks the point at which the system’s response deviates significantly from its low-frequency behavior. It is a critical system-analysis parameter that indicates the transition between different frequency regimes.
How do gain margin and phase margin affect system stability?
Gain margin and phase margin quantify a system’s stability. A higher gain margin indicates greater stability, as the system can tolerate more gain before becoming unstable. Similarly, a higher phase margin implies better stability, reflecting the difference between the actual and critical phases for stability.
Can Bode plots be used to analyze nonlinear systems?
Bode plots are primarily applicable to linear time-invariant (LTI) systems. While they may provide some insights into the behavior of nonlinear systems under certain conditions, their effectiveness is limited in such cases. Nonlinear systems often require more sophisticated analysis techniques beyond the scope of Bode plots.